Tools & Dashboards
Interactive tools for exploring population futures
PSR HUB develops dashboards, Shiny apps, projection viewers, and visual analytics that help researchers, students, planners, and policy audiences explore demographic change.
Featured tools
Dashboards and projection viewers
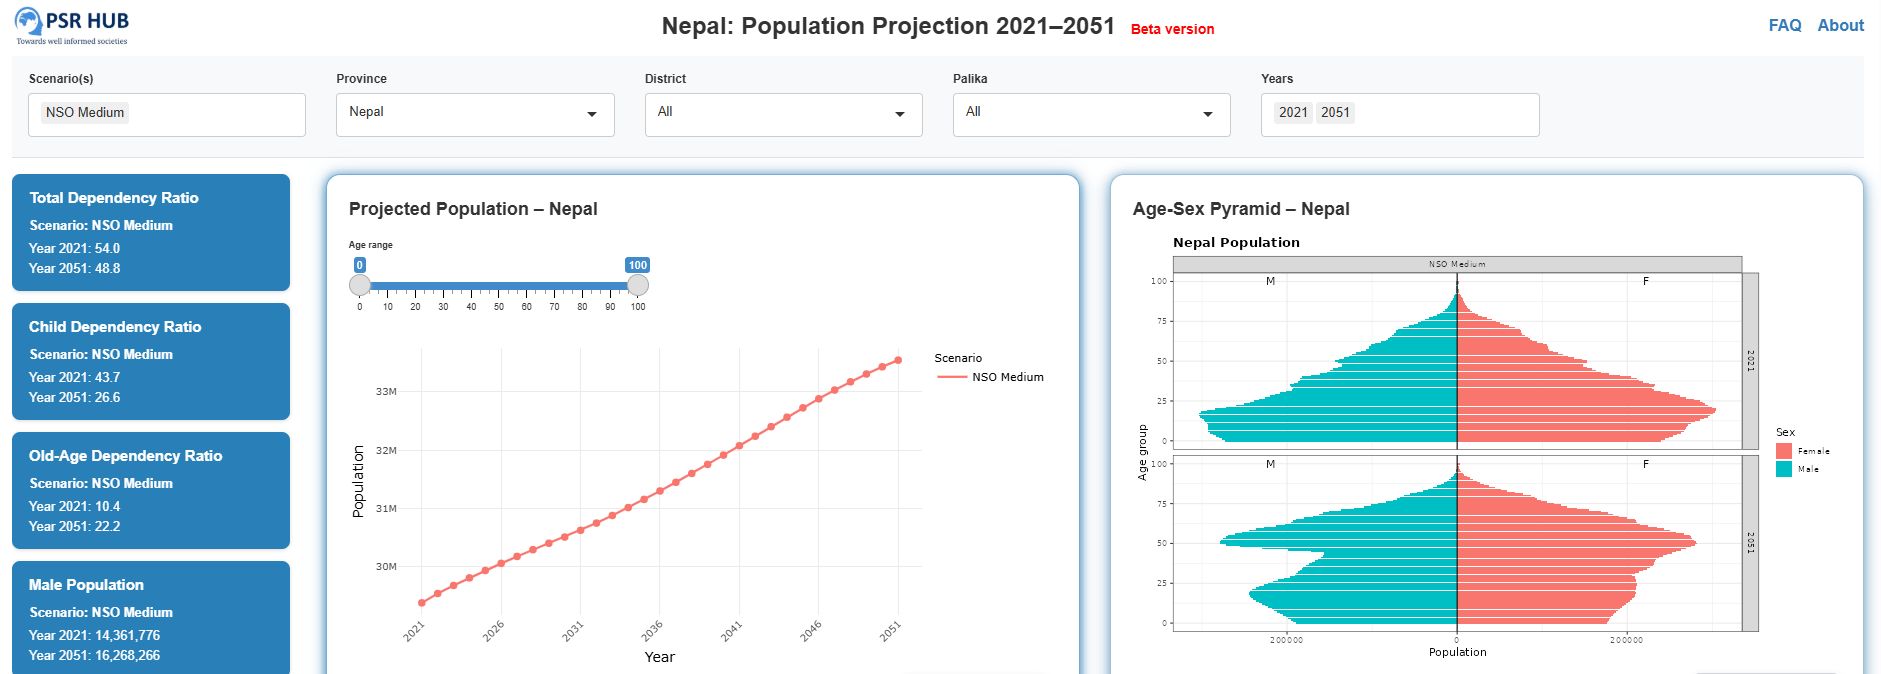
Shiny dashboard
Nepal Population Projection Dashboard
A visual entry point for exploring Nepal population projection results for 2021-2051.
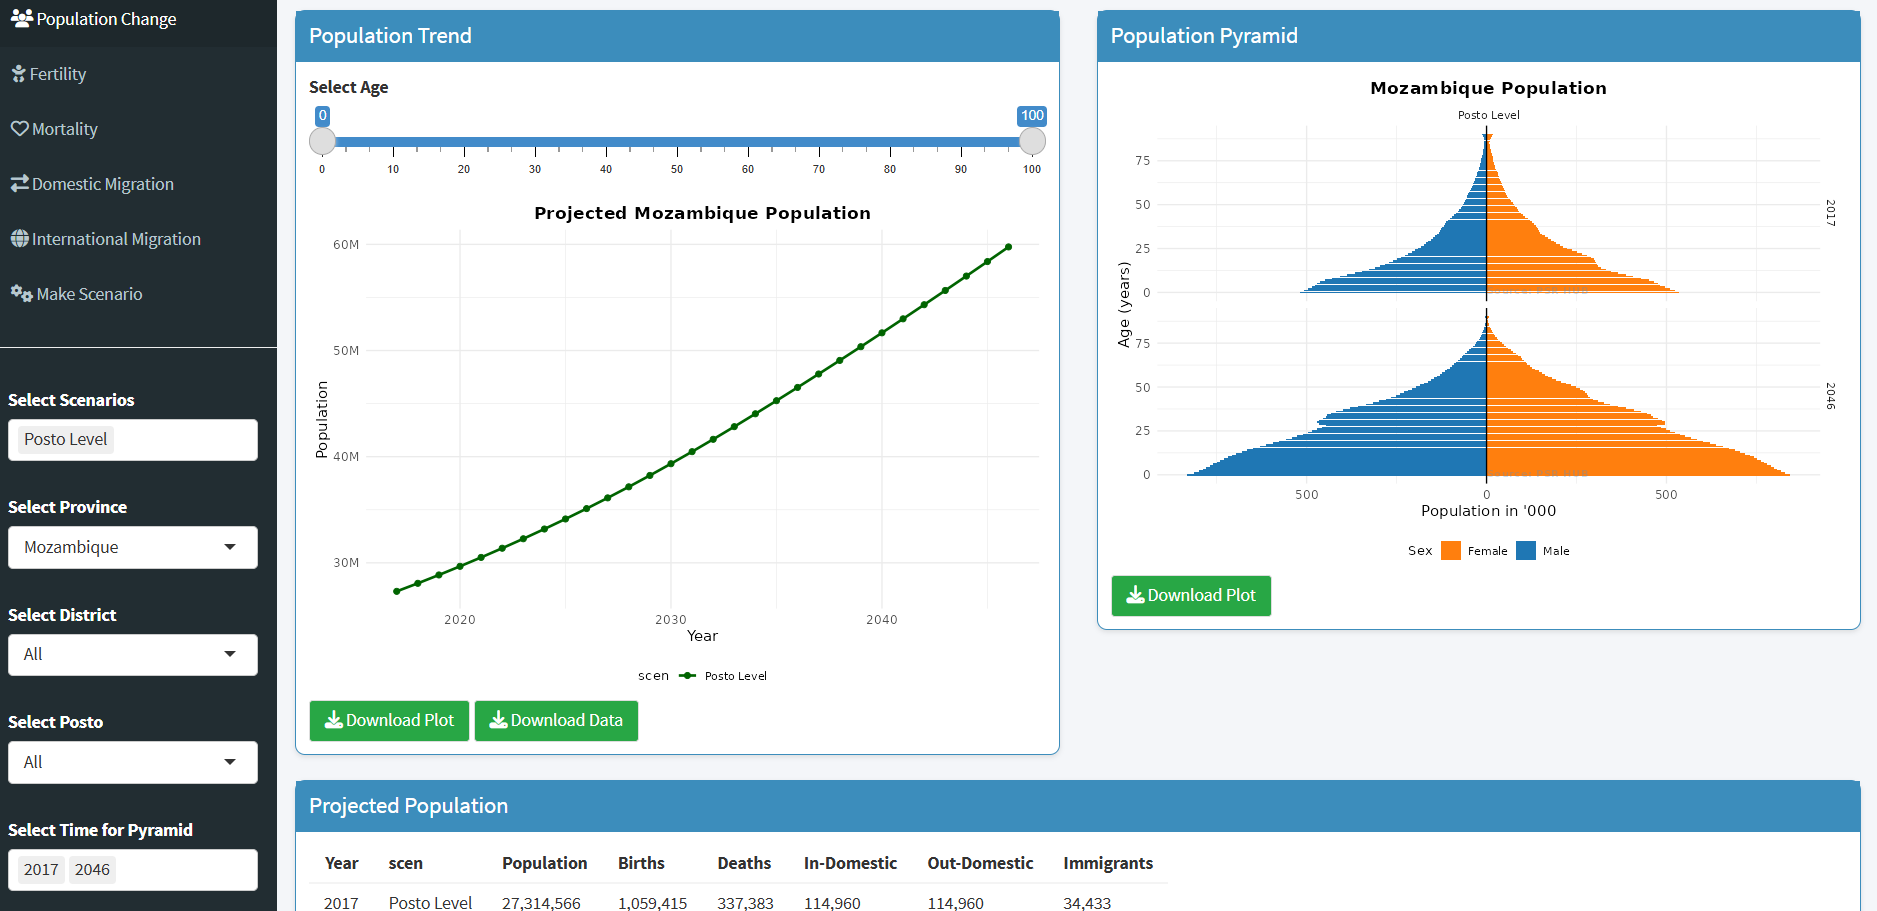
Shiny dashboard
Mozambique Population Projection Dashboard
A projection viewer connected to Mozambique population projection work and workshop engagement.
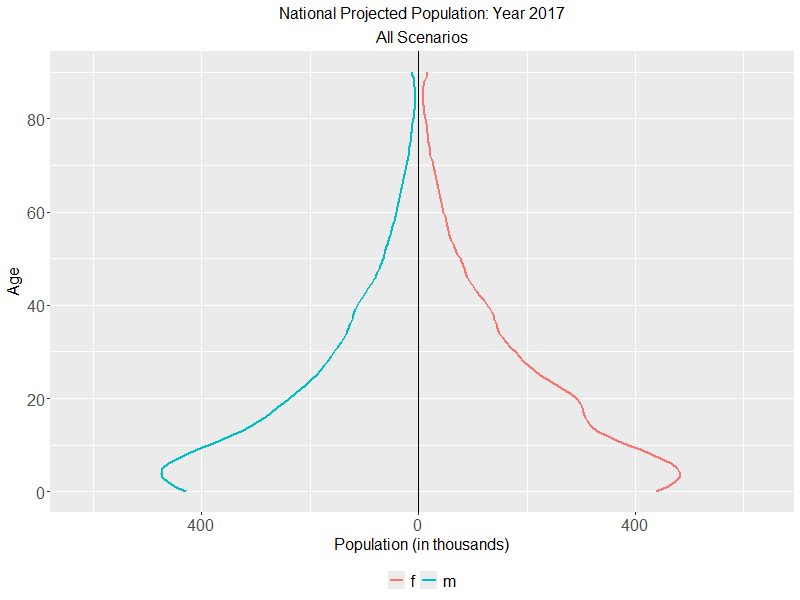
Visualization
Population visualizations
Graphs, animations, and visual outputs for communicating population structure and change.
How tools connect
From research to usable evidence
Projection results
Dashboards help users explore projection outputs by place, time, age structure, and scenario.
Teaching and training
Tools support workshops, R training, and applied demographic modelling sessions.
Policy communication
Visual tools help translate complex demographic results into more accessible public and policy evidence.
Project hubs
Each tool can be linked to related papers, reports, visual cards, datasets, and activities.
Future tools
Tools under development
Future tools may include new Shiny apps, projection viewers, maps, POPSYM-related outputs, reproducible dashboards, and teaching interfaces connected to PSR HUB research projects.
Use or collaborate on PSR HUB tools
For dashboard development, projection visualization, training, or collaboration, contact the PSR HUB team.
