
Project hub
Population Projections for Nepal 2021-2051
Subnational population projection work supporting planning, policy, dashboards, visual communication, and public understanding of Nepal’s demographic future.
Main output
From demographic model to usable evidence
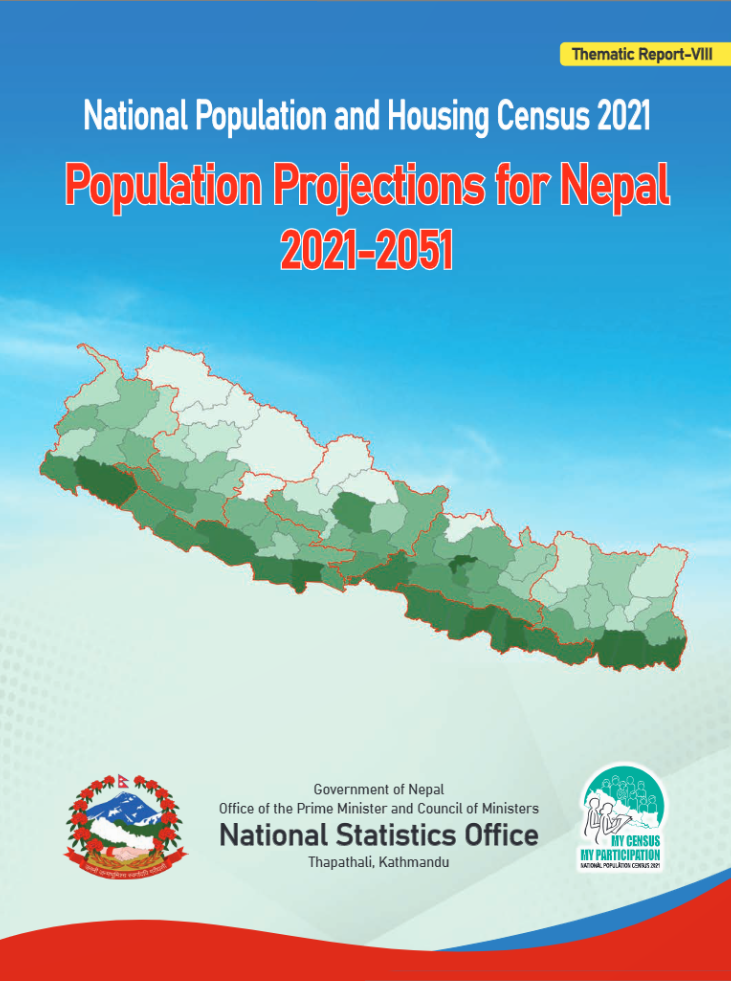
The National Statistical Office of Nepal published a comprehensive population projection report down to the ward level. The work was commissioned by the NSO and supported by UNFPA Nepal, with PSR HUB providing technical support around projection modelling, analysis, and communication of results.
The projection work examines fertility, mortality, migration, age structure, and future population scenarios across multiple levels of Nepal’s administrative hierarchy. It provides a foundation for evidence-informed planning, local development, policy discussion, and future dashboard and visual outputs.
What this work supports
A projection base for research, planning, and communication
Subnational planning
Population evidence for provinces, districts, municipalities, wards, and local planning questions.
Demographic scenarios
Analysis of fertility, mortality, migration, population ageing, dependency, and future change.
Dashboards and tools
Interactive views that help users explore results by place, age, sex, year, and indicator.
Public communication
Visual cards and briefs that translate technical projection results into accessible evidence.
Connected outputs
Report, dashboard, and visual explainers
Report
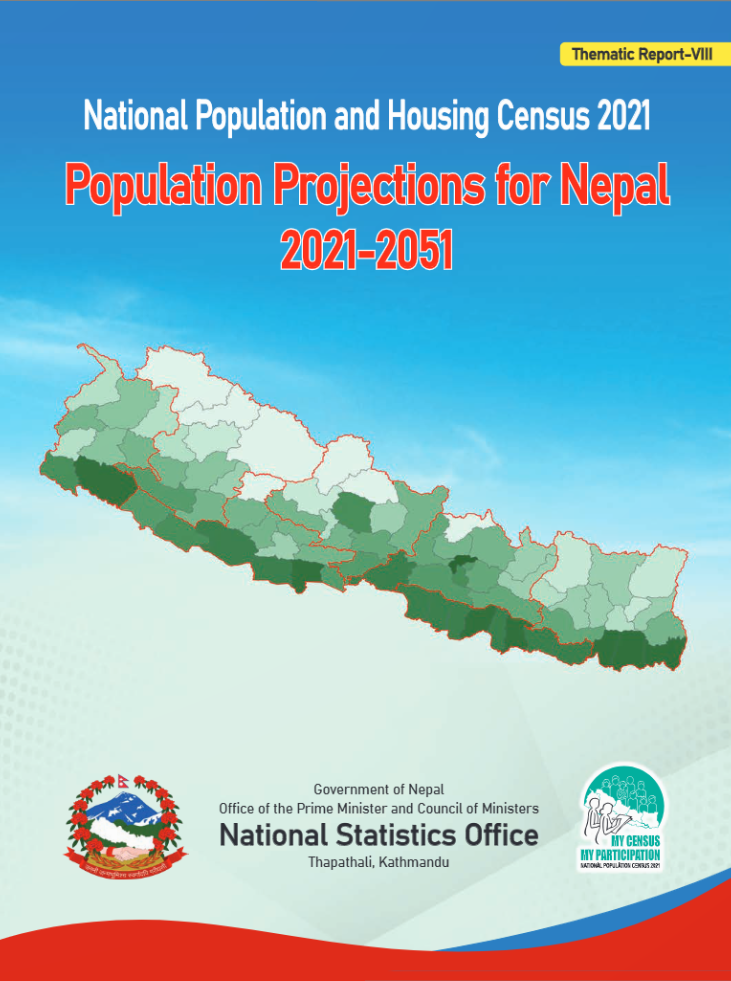
NSO population projection report
The main report for Nepal’s population projections, published by the National Statistical Office.
Dashboard
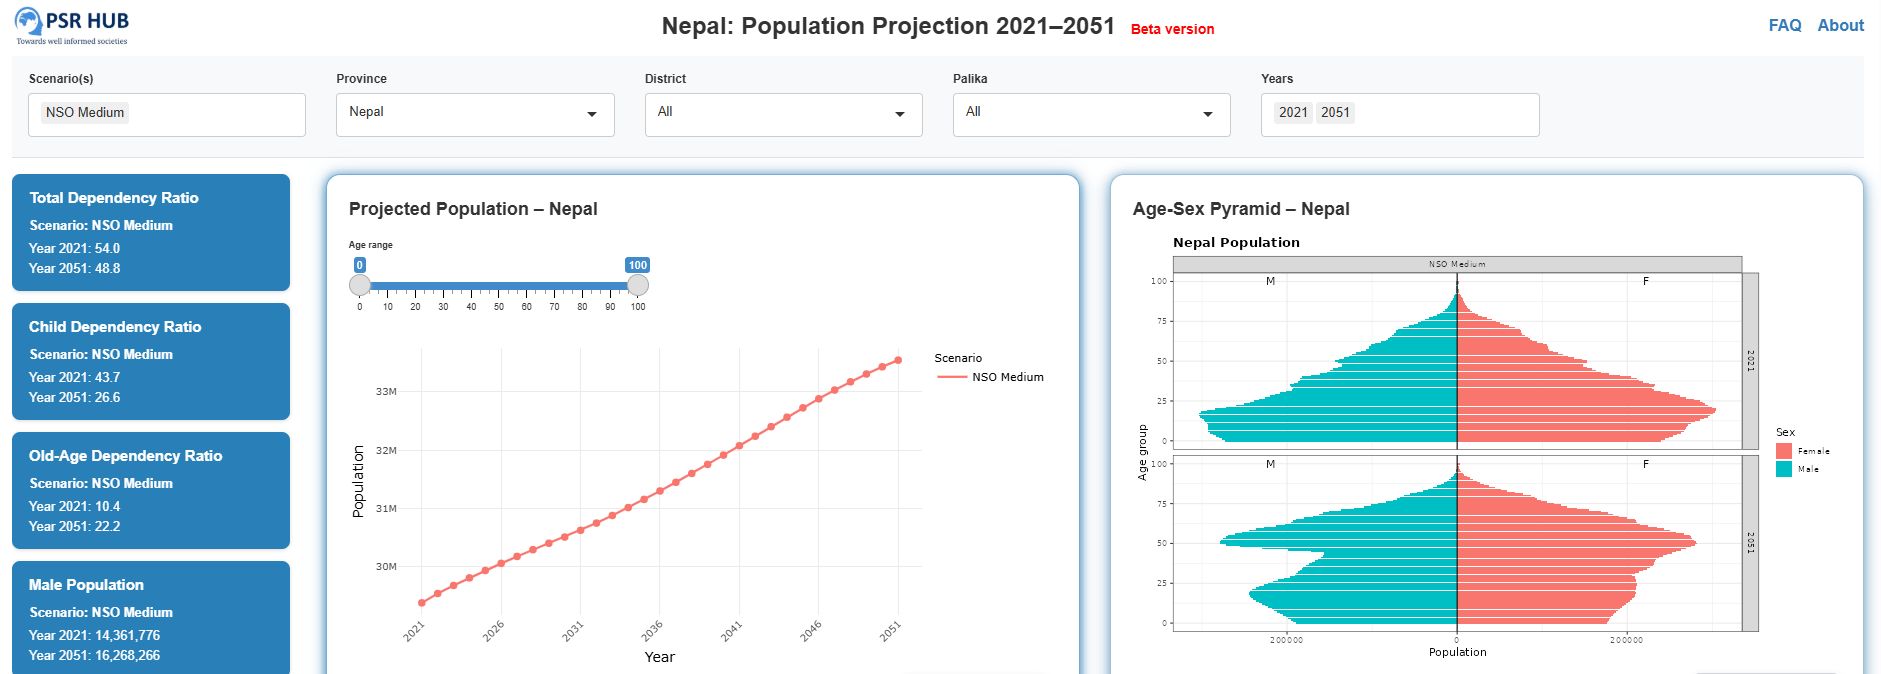
Nepal projection dashboard
A Shiny-based visual entry point for exploring projection indicators and subnational results.
Visual card
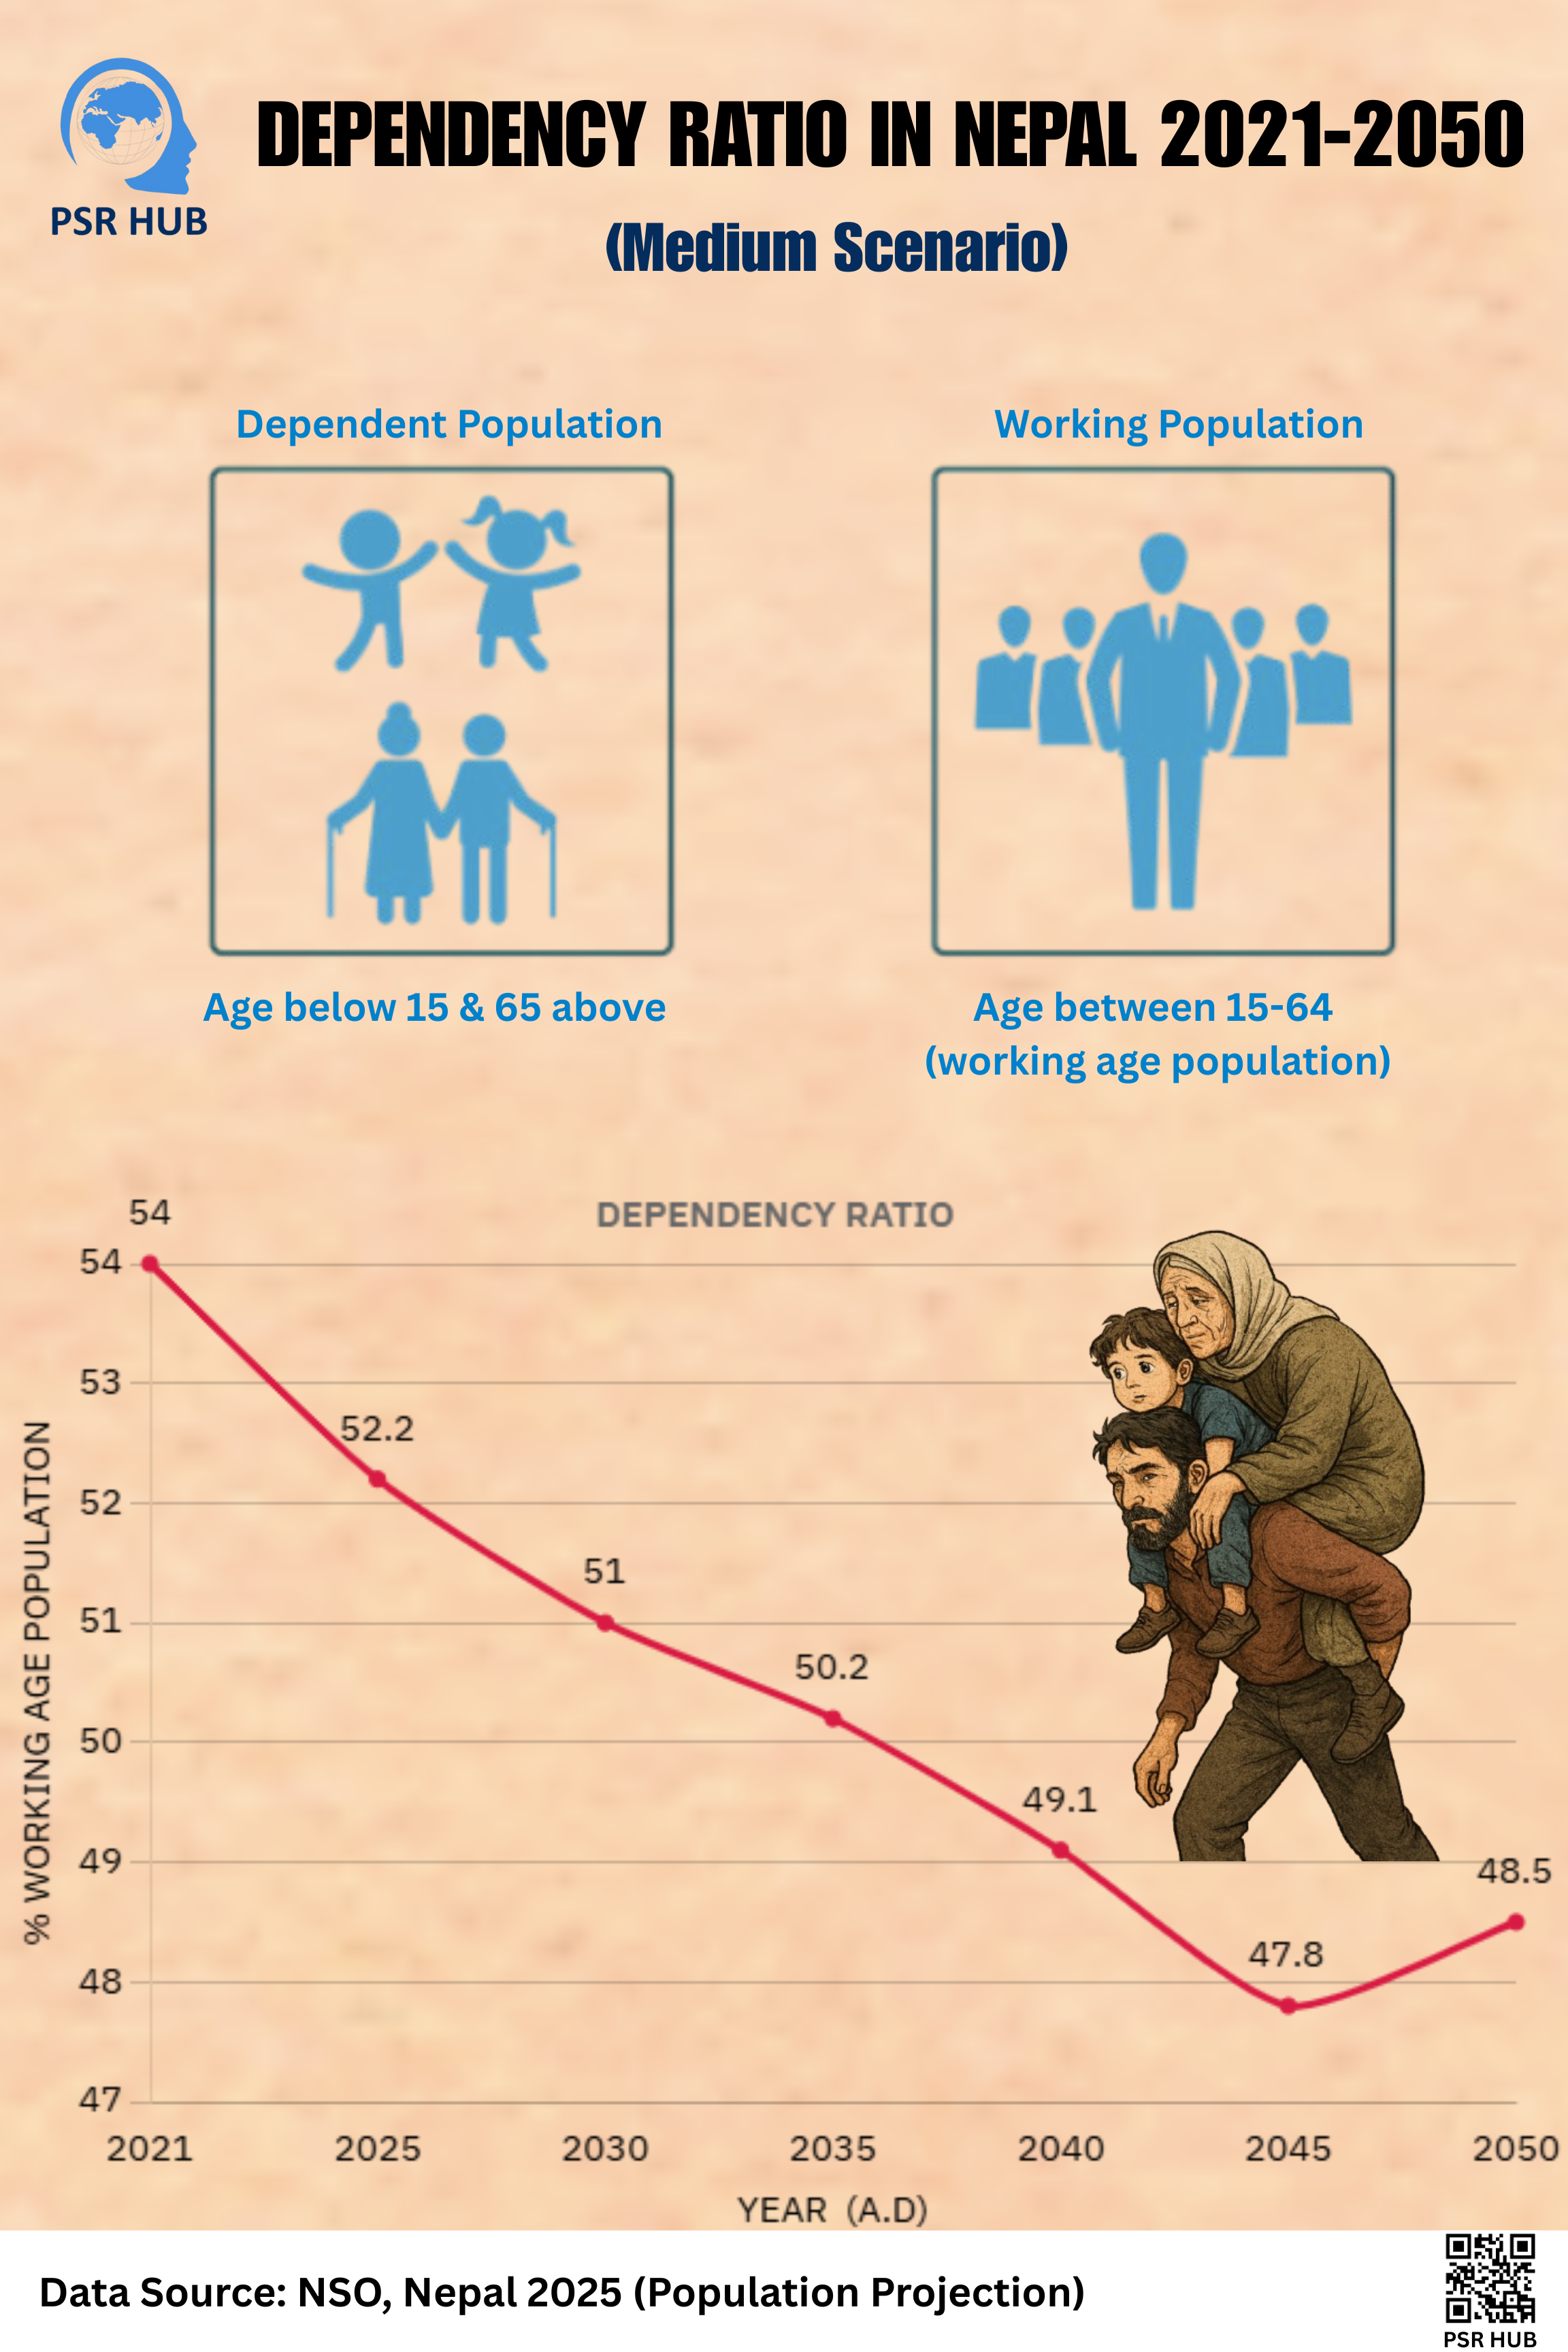
Ageing and dependency
A short visual explanation of how age structure and dependency may change over time.
Visual analysis
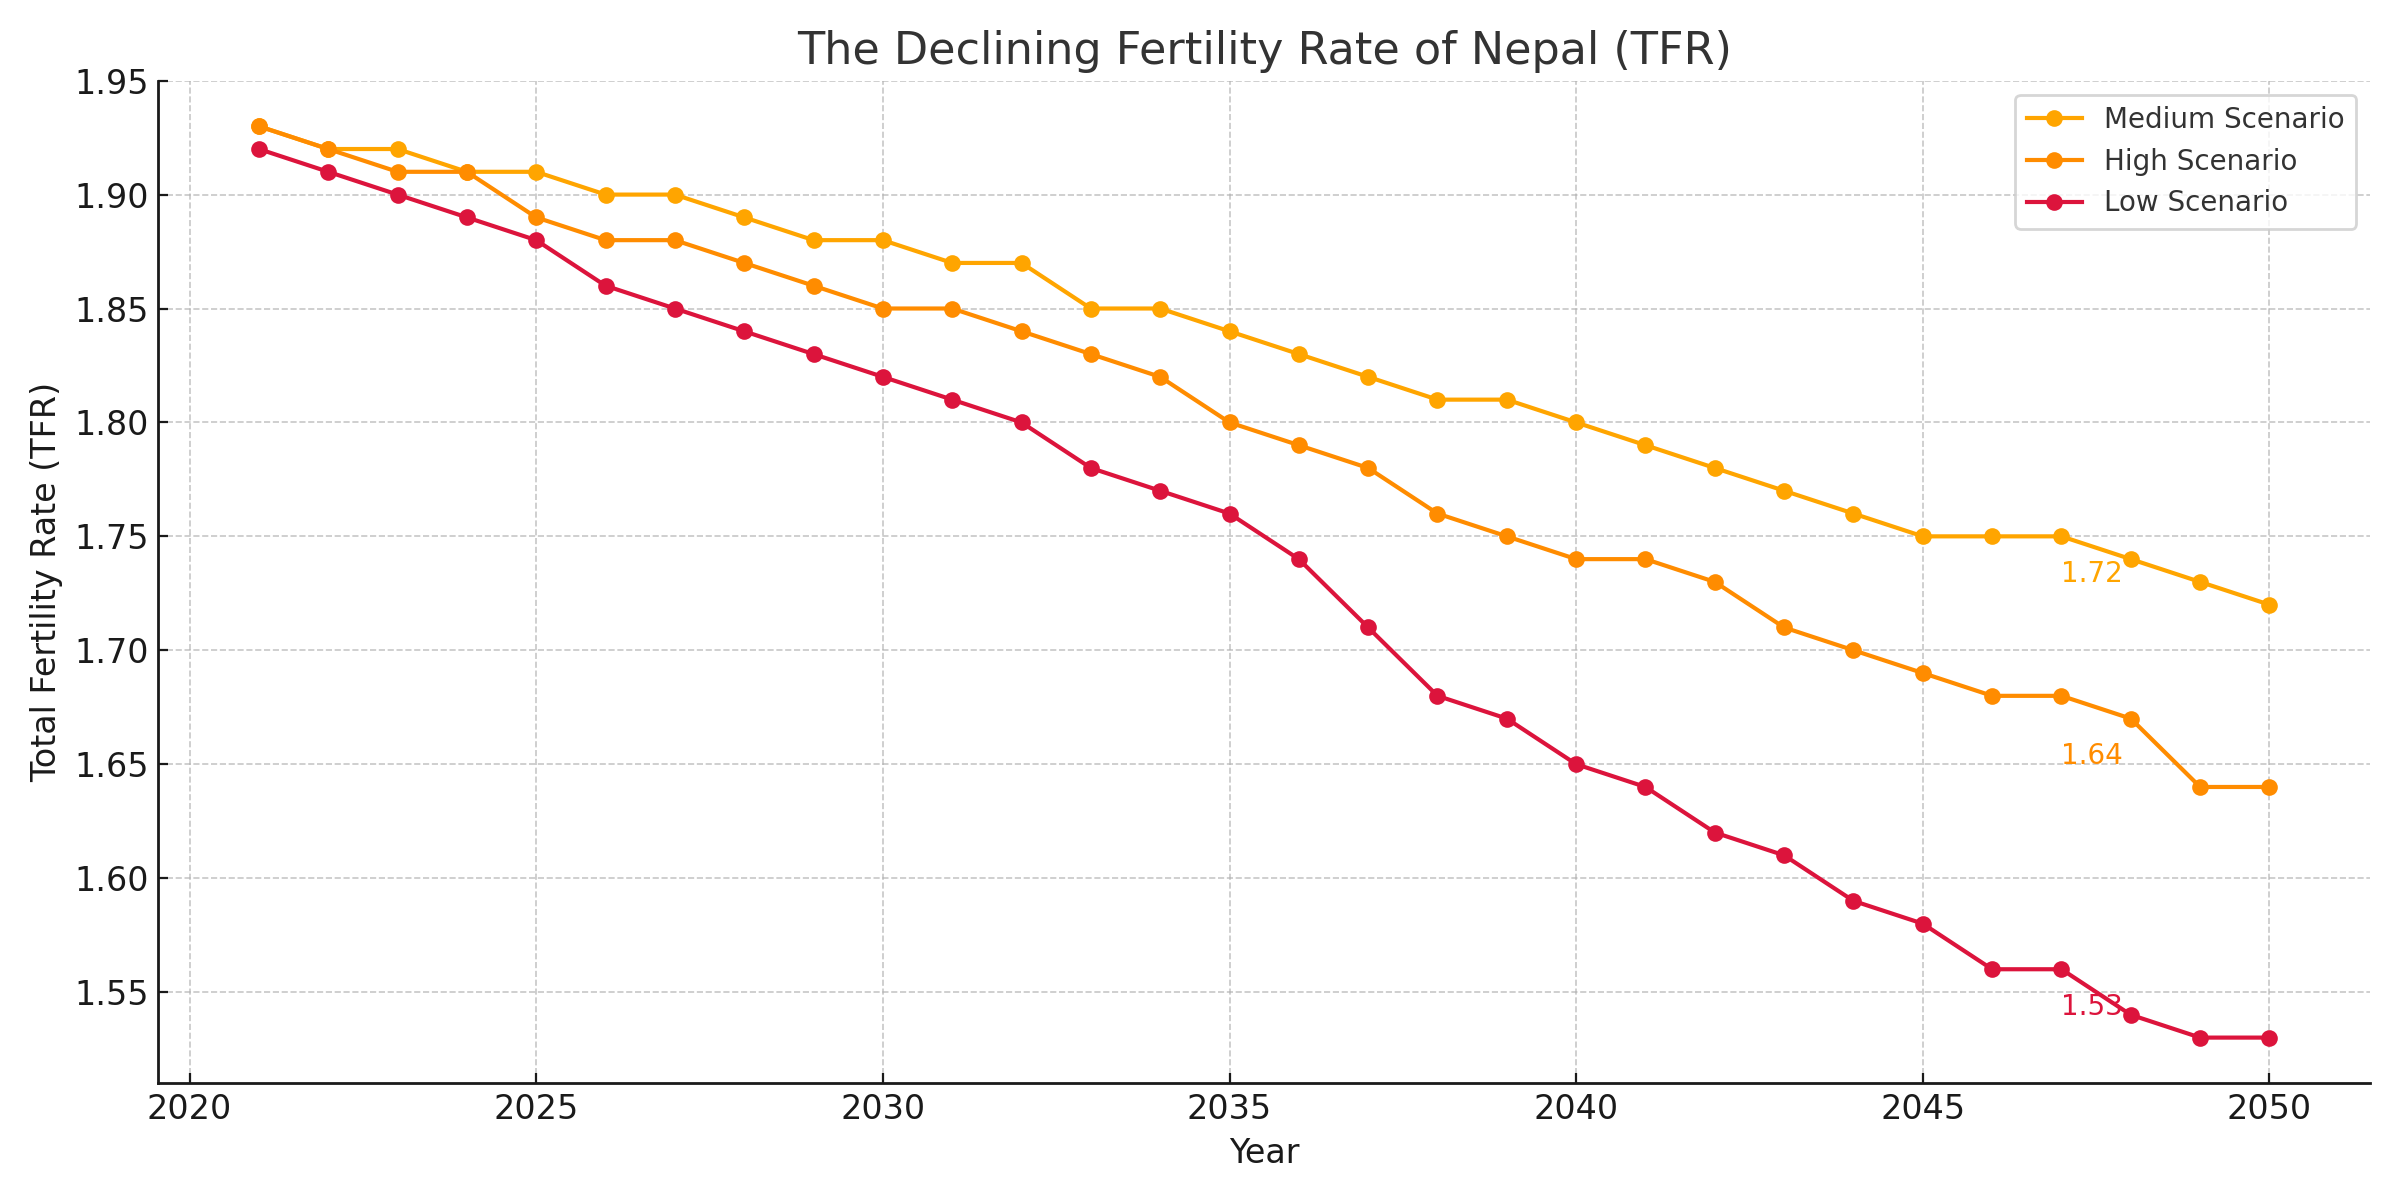
Fertility assumptions and scenarios
Visual material that can support discussion of fertility trends and future population scenarios.
Use or collaborate on Nepal projection work
For research collaboration, dashboard development, training, visual communication, or policy use of the projection results, contact the PSR HUB team.
 PSR HUB